
City of Harare
Zimbabwe · Africa
Key facts
- Population
- 1,849,617
- ZIMSTAT 2022 Population and Housing Census, Harare Urban District (city administrative unit; excludes Chitungwiza and Epworth)
- Harare Province as a whole (Harare, Chitungwiza and Epworth): 2,427,231 people; province-wide density 2,784 per km²
- Time zone
- UTC+2 (Central Africa Time)
- No daylight saving time
- Official languages
- 16 officially recognised languages, including English, Shona and Ndebele
- Chewa, Chibarwe, English, Kalanga, Koisan, Nambya, Ndau, Ndebele, Shangani, Shona, sign language, Sotho, Tonga, Tswana, Venda, Xhosa
- Currency
- Zimbabwe Gold (ZiG)
- ZWG; foreign currencies (such as USD) are also legal tender alongside it
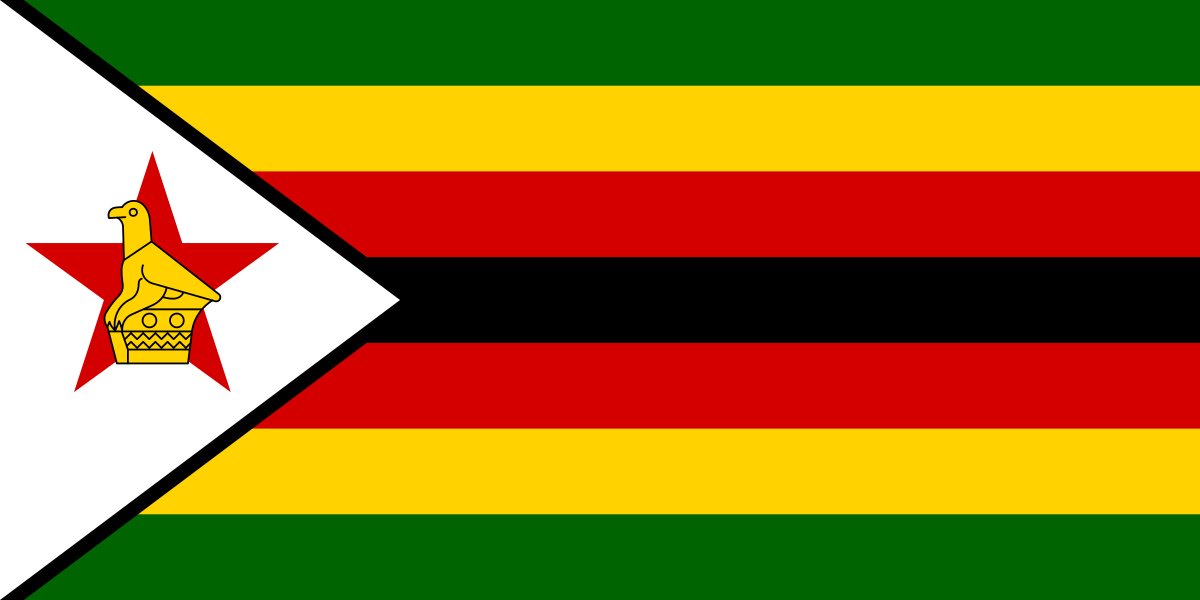 Zimbabwe
Harare is a city in Zimbabwe with 1,849,617 residents (ZIMSTAT 2022 Population and Housing Census, Harare Urban District (city administrative unit; excludes Chitungwiza and Epworth)). The warmest month averages a high of 28.8 °C; 841 mm of rain a year.
Climate
1961–1990 climate normals for the Harare Kutsaga (WMO WWIS, Zimbabwe Meteorological Services Department; elevation not given on the page) station. Orange bars are the average daily high, blue bars the average daily low; the lower bars show rainfall.
| Jan | Feb | Mar | Apr | May | Jun | Jul | Aug | Sep | Oct | Nov | Dec | Year | |
|---|---|---|---|---|---|---|---|---|---|---|---|---|---|
| Average high (°C) | 26.2 | 26.0 | 26.2 | 25.6 | 23.8 | 21.8 | 21.6 | 24.1 | 28.4 | 28.8 | 27.6 | 26.3 | 25.5 |
| Average low (°C) | 15.8 | 15.7 | 14.5 | 12.5 | 9.3 | 6.8 | 6.5 | 8.5 | 11.7 | 14.5 | 15.5 | 15.8 | 12.3 |
| Rainfall (mm) | 190.8 | 176.3 | 99.1 | 37.2 | 7.4 | 1.8 | 2.3 | 2.9 | 6.5 | 40.4 | 93.2 | 182.7 | 840.6 |
1961–1990 normals supplied by the Zimbabwe Meteorological Services Department to WMO, not 1991–2020 normals. The source gives no mean temperature, no days with ≥ 1 mm rain (rain-day counts are given without a stated threshold) and no days ≥ 30 °C. Annual tx and tn are the mean of the 12 months; annual rain is the 12-month sum.
Frequently asked questions about Harare
What is the population of Harare?
Harare has 1,849,617 residents (ZIMSTAT 2022 Population and Housing Census, Harare Urban District (city administrative unit; excludes Chitungwiza and Epworth)).
What is the climate like in Harare?
Based on the 1961–1990 climate normals, the warmest month is Oct with an average high of 28.8 °C. The wettest month is Jan (190.8 mm). Annual rainfall is 840.6 mm.
Where does the data on this page come from?
Every figure comes from a statistical office, meteorological service, operator or international body; the source of each figure is listed on the Harare sources page.
What the profile contains
- Population, area, climate and infrastructure from government bodies
- Home prices, rents, earnings, living costs and safety for the city
Source of every figure
- Each figure names the body, the period and the original link
- No aggregator or open-encyclopedia sites
Method
- City figures refer to the municipality unless marked as the metropolitan area
- No estimates: missing figures are left blank